返回目录
用于查看完整数学公式:手机用户长按公式/PC用户右击公式出现菜单栏点击Math Settings—>Zoom Trigger—>Double-Click即可双击放大文中基于mathjax的公式与图表
1. 什么是决策树
在日常生活中,当我们判别一件商品的好坏时,经常会通过这类商品的某些属性来进行决策,例如判断一个西瓜是否是好瓜,我们通常会先观察这个西瓜的色泽是不是青绿色的,如果色泽是青绿色的则继续观察它的根蒂是不是蜷缩的,如果根蒂是蜷缩的,则会听听它的敲声是否清脆,如果满足以上一系列条件那么我们就将这个西瓜判别为很可能是个好瓜。以上的决策过程可以用下图的树形结构来表示,而上文中的粗体字即为样本的属性,斜体字即为对应熟悉的属性值,例如属性色泽有属性值:青绿、乌黑、浅白。
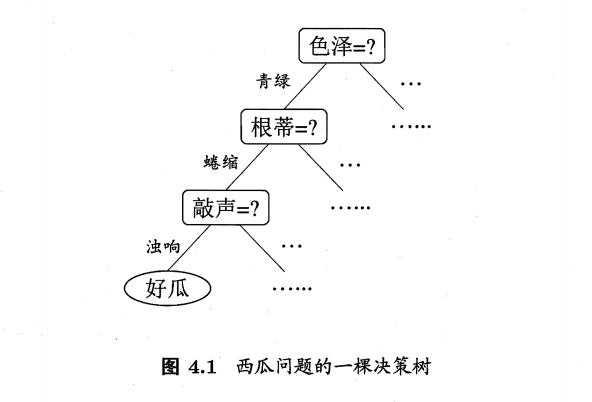
一般来讲,一颗决策树包含一个根结点,若干个内节点和若干个叶子结点,根结点中包含了所有的样本,而内结点中包含了所有满足从根结点到父结点中属性要求的样本子集,叶子结点即为满足这条分支上所有属性要求的样本所属的类别。
决策树的目的是为了产生一颗泛化能力强的决策树,其基本流程如下:

递归终止条件:
- 若当前节点包含的样本全属于同一类别则无需划分;
- 若当前节点的属性集为空,或者所有属性的属性值全部相同,则无法划分,此时将拥有样本数量最多的类别作为该结点的类别标记;
- 当前结点包含的样本集合为空,不能划分,此时将该结点设为叶子结点,将父结点中所含样本数量最多的类别作为该叶子结点的类别。
2. 如何选择最优属性
2.1 信息增益==>ID3
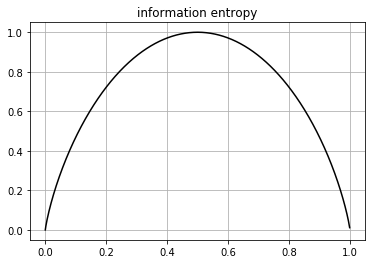
信息熵(information entropy)
-
度量样本集合纯度的一种指标
-
公式: \(Ent(D)=-\sum^{|y|}_{k=1}p_klog_2p_k\)
-
$Ent(D)$的值越小, $D$的纯度越高
p = np.linspace(start=0, stop=1, num=1000) + np.spacing(1)
Ent = -p*np.log2(p)-(1-p)*np.log2(1-p)

plt.plot(p, Ent, 'k')
plt.title("information entropy")
plt.grid()
plt.show()
def Ent(D):
    D_pos = sum(D["好瓜"]=="是")
    D_neg = sum(D["好瓜"]=="否")
    p_pos = D_pos / D.shape[0] + np.spacing(1)
    p_neg = D_neg / D.shape[0] + np.spacing(1)
    entropy_D = -p_pos*np.log2(p_pos)-p_neg*np.log2(p_neg)
    return entropy_D
Ent(xigua2_0)
# [output]: 0.997502546369115
信息增益(information gain):
- 公式:
\(Gain(D, a)=Ent(D) - \sum_{v=1}^{V}\frac{|D^v|}{|D|}Ent(D^v)\) - 缺点:可能对取值数目较多的属性有所偏好
def Gain(D, a):
    n_D = D.shape[0]
    V = D[a].unique()
    entropy_dic = {}
    num_dict = {}
    for v in V:
        Dv = D[D[a]==v]
        n_Dv = Dv.shape[0]
        num_dict[v] = n_Dv
        entropy_v = Ent(D[D[a]==v])
        entropy_dic[v] = entropy_v
    gain_D_a = Ent(D) - sum((np.divide(list(num_dict.values()), n_D) * list(entropy_dic.values())))
    return gain_D_a
Gain(xigua2_0, "色泽")
# [output]: 0.10812516526536509
Gain(xigua2_0[xigua2_0["纹理"]=="清晰"], "色泽")
# [output]: 0.04306839587827871
2.2 增益率==>C4.5
增益率
-
公式:\(Gain\_ratio(D, a) = \frac{Gain(D, a)}{IV(a)},\)其中$$IV(a) = -\sum^{V}_{v=1}\frac{ D^v }{ D }log_2\frac{ D^v }{ D }$$ - 解决了信息增益偏好取值数量多的属性的问题
- 缺点:增益率对可取值数量少的属性有所偏好
解决方法:先从候选划分属性中找出信息增益高于平均水平的属性,再从中选择增益率最高的属性
def IV(D, a):
    num_D = D.shape[0]
    V = D[a].unique()
    iva = 0
    for v in V:
        Dv = D[D[a]==v]
        num_Dv = Dv.shape[0]
        iva -= (num_Dv/num_D) * np.log2((num_Dv + np.spacing(1))/(num_D + np.spacing(1)))
    return iva
def Gain_tatio(D, a):
    return Gain(D, a) / IV(D, a)
Gain_tatio(xigua2_0, "触感")
# [output]: 0.006918329853400173
2.3 基尼指数==>CART
基尼指数
-
公式:
$$ \begin{eqnarray*}Gini(D) &= \sum{k=1}^{ y }\sum{k\neq k’}p_kp_{k’}\ &= 1 - \sum_{k=1}^{ y }p_k^2 \end{eqnarray*} $$
-
另一种度量数据集$D$纯度的指标, 反映了从数据集$D$中随机选取两个样本,其类别标记不一样的概率
-
$Gini(D)$越小,数据集$D$的纯度越高
def Gini(D):
    y = D["好瓜"].unique()
    num_y = len(y)
    sum_pk2 = 0
    for k in range(num_y):
        pk = D[D["好瓜"]==y[k]].shape[0] / D.shape[0]
        sum_pk2 += pk ** 2
    gini_D = 1 - sum_pk2
    return gini_D
Gini(xigua2_0)
# [output]: 0.4982698961937716
def Gini_index(D, a):
    V = D[a].unique()
    num_D = D.shape[0]
    gini_index = 0
    for v in V:
        Dv = D[D[a]==v]
        num_Dv = Dv.shape[0]
        gini_index += (num_Dv / num_D) * Gini(Dv)
    return gini_index
Gini_index(xigua2_0, "色泽")
# [output]: 0.42745098039215684
3. 决策树实现:
3.1 训练:
def val_values(D, A):
    A = list(A)
    flag = [False] * len(A)
    for i in range(len(A)):
        if len(D[A[i]].unique()) == 1:
            flag[i] = True
    if sum(flag) == len(flag):
        return True
    else:
        return False
def top1_label(node):
    labels = set(node)
    counter = {}
    for label in labels:
        counter[label] = node.count(label)
    return max(counter.items(), key=lambda v:v[1])[0]
def best_attribute(D, A, tree_type):
    if tree_type == "ID3":
        gain = {}
        for a in list(A):
            gain[a] = Gain(D, a)
        return max(gain.items(), key=lambda v:v[1])[0]

    elif tree_type == "C4.5":
        gain = {}
        gain_tatio ={}
        for a in list(A):
            gain[a] = Gain(D, a)
        gain_mean = np.mean(list(gain.values()))
        res_keys = [k for k, v in gain.items() if v>gain_mean]
        for key in res_keys:
            gain_tatio[key] = Gain_tatio(D, key)
        return max(gain_tatio.items(), key=lambda v:v[1])[0]

    elif tree_type == "CART":
        gini_index = {}
        for a in list(A):
            gini_index[a] = Gini_index(D, a)
        return min(gini_index.items(), key=lambda v:v[1])[0]
    else:
        print("tree_type MUST be 'ID3' or 'C4.5' or 'CART'!")
def TreeGenerate(D, A, tree_type):
    node = D["好瓜"]
    if len(node.unique()) == 1:
        return node.unique()
    if len(A) == 0 or val_values(D, A) == True:
        return top1_label(node)
    a_best = best_attribute(D, A, tree_type)
    my_tree = {a_best:{}}
    a_best_V = D[a_best].unique()
    for a_best_v in a_best_V:
        Dv = D[D[a_best]==a_best_v]
        node_v = Dv["好瓜"]
        if Dv.shape[0] == 0:
            return top1_label(node_v)
        else:
            my_tree[a_best][a_best_v] = TreeGenerate(Dv, A-set(a_best), tree_type)
    return my_tree
t_ID3 = TreeGenerate(xigua2_0, set(xigua2_0.keys())-set(["好瓜"]), "ID3")
t_C45 = TreeGenerate(xigua2_0, set(xigua2_0.keys())-set(["好瓜"]), "C4.5")
t_CART = TreeGenerate(xigua2_0, set(xigua2_0.keys())-set(["好瓜"]), "CART")
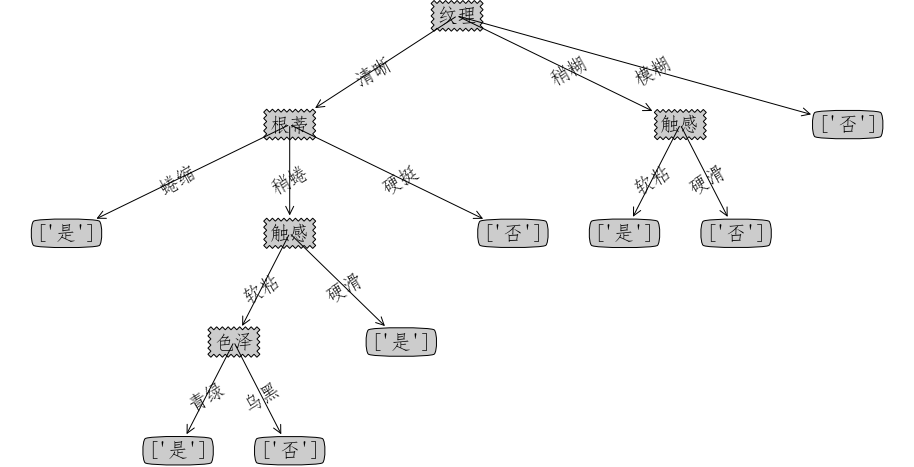
print("ID3:\n", t_ID3)
print("C4.5:\n", t_C45)
print("CART:\n", t_CART)
# [output]:
# ID3:
# {'纹理': {'清晰': {'根蒂': {'蜷缩': array(['是'], dtype=object), '稍蜷': {'触感': {'软粘': {'色泽': {'青绿': array(['是'], dtype=object), '乌黑': array(['否'], dtype=object)}}, '硬滑': array(['是'], dtype=object)}}, '硬挺': array(['否'], dtype=object)}}, '稍糊': {'触感': {'软粘': array(['是'], dtype=object), '硬滑': array(['否'], dtype=object)}}, '模糊': array(['否'], dtype=object)}}
# C4.5:
# {'纹理': {'清晰': {'触感': {'硬滑': array(['是'], dtype=object), '软粘': {'根蒂': {'稍蜷': {'色泽': {'青绿': array(['是'], dtype=object), '乌黑': array(['否'], dtype=object)}}, '硬挺': array(['否'], dtype=object)}}}}, '稍糊': {'触感': {'软粘': array(['是'], dtype=object), '硬滑': array(['否'], dtype=object)}}, '模糊': array(['否'], dtype=object)}}
# CART:
# {'纹理': {'清晰': {'根蒂': {'蜷缩': array(['是'], dtype=object), '稍蜷': {'触感': {'软粘': {'色泽': {'青绿': array(['是'], dtype=object), '乌黑': array(['否'], dtype=object)}}, '硬滑': array(['是'], dtype=object)}}, '硬挺': array(['否'], dtype=object)}}, '稍糊': {'触感': {'软粘': array(['是'], dtype=object), '硬滑': array(['否'], dtype=object)}}, '模糊': array(['否'], dtype=object)}}
3.2 预测:
def single_predict(sample, my_tree):
    first_key = list(my_tree.keys())[0]
    secondDict = my_tree[first_key]
    if type(secondDict[sample[first_key]]).__name__ == 'dict':
        label = single_predict(sample, secondDict[sample[first_key]])
    else:
        label = secondDict[sample[first_key]]
    return label
def predict(D_test, my_tree):
    result = []
    for i in range(len(D_test)):
        sample = D_test.iloc[i]
        label = single_predict(sample, my_tree)
        result.append(label)
    return result
3.3 可视化:
import matplotlib.pyplot as plt  # 载入 pyplot API
from pylab import mpl
mpl.rcParams['font.sans-serif'] = ['FangSong'] # 指定默认字体
mpl.rcParams['axes.unicode_minus'] = False # 解决保存图像是负号'-'显示为方块的问题
mpl.rcParams['font.size'] = 20

decisionNode = dict(boxstyle="sawtooth", fc="0.8")
leafNode = dict(boxstyle="round4", fc="0.8")
arrow_args = dict(arrowstyle="<-")
#绘制带箭头的注解
#nodeTxt:节点的文字标注, centerPt:节点中心位置,
#parentPt:箭头起点位置(上一节点位置), nodeType:节点属性
def plotNode(nodeTxt, centerPt, parentPt, nodeType):
    createPlot.ax1.annotate(nodeTxt, xy=parentPt,  xycoords='axes fraction',
             xytext=centerPt, textcoords='axes fraction',
             va="center", ha="center", bbox=nodeType, arrowprops=arrow_args )
#计算叶节点数
def getNumLeafs(myTree):
    numLeafs = 0
    firstStr = list(myTree.keys())[0]
    secondDict = myTree[firstStr]
    for key in secondDict.keys():
        if type(secondDict[key]).__name__=='dict':#是否是字典
            numLeafs += getNumLeafs(secondDict[key]) #递归调用getNumLeafs
        else:   numLeafs +=1 #如果是叶节点,则叶节点+1
    return numLeafs
#计算数的层数
def getTreeDepth(myTree):
    maxDepth = 0
    firstStr = list(myTree.keys())[0]
    secondDict = myTree[firstStr]
    for key in secondDict.keys():
        if type(secondDict[key]).__name__=='dict':#是否是字典
            thisDepth = 1 + getTreeDepth(secondDict[key]) #如果是字典,则层数加1,再递归调用getTreeDepth
        else:   thisDepth = 1
        #得到最大层数
        if thisDepth > maxDepth:
            maxDepth = thisDepth
    return maxDepth
#在父子节点间填充文本信息
#cntrPt:子节点位置, parentPt:父节点位置, txtString:标注内容
def plotMidText(cntrPt, parentPt, txtString):
    xMid = (parentPt[0]-cntrPt[0])/2.0 + cntrPt[0]
    yMid = (parentPt[1]-cntrPt[1])/2.0 + cntrPt[1]
    createPlot.ax1.text(xMid, yMid, txtString, va="center", ha="center", rotation=30)
#绘制树形图
#myTree:树的字典, parentPt:父节点, nodeTxt:节点的文字标注
def plotTree(myTree, parentPt, nodeTxt):
    numLeafs = getNumLeafs(myTree)  #树叶节点数
    depth = getTreeDepth(myTree)    #树的层数
    firstStr = list(myTree.keys())[0]     #节点标签
    #计算当前节点的位置
    cntrPt = (plotTree.xOff + (1.0 + float(numLeafs))/2.0/plotTree.totalW, plotTree.yOff)
    plotMidText(cntrPt, parentPt, nodeTxt) #在父子节点间填充文本信息
    plotNode(firstStr, cntrPt, parentPt, decisionNode) #绘制带箭头的注解
    secondDict = myTree[firstStr]
    plotTree.yOff = plotTree.yOff - 1.0/plotTree.totalD
    for key in secondDict.keys():
        if type(secondDict[key]).__name__=='dict':#判断是不是字典,
            plotTree(secondDict[key],cntrPt,str(key))        #递归绘制树形图
        else:   #如果是叶节点
            plotTree.xOff = plotTree.xOff + 1.0/plotTree.totalW
            plotNode(secondDict[key], (plotTree.xOff, plotTree.yOff), cntrPt, leafNode)
            plotMidText((plotTree.xOff, plotTree.yOff), cntrPt, str(key))
    plotTree.yOff = plotTree.yOff + 1.0/plotTree.totalD
#创建绘图区
def createPlot(inTree):
    fig = plt.figure(1, facecolor='white', figsize=(16, 8))
    fig.clf()
    axprops = dict(xticks=[], yticks=[])
    createPlot.ax1 = plt.subplot(111, frameon=False, **axprops)
    plotTree.totalW = float(getNumLeafs(inTree)) #树的宽度
    plotTree.totalD = float(getTreeDepth(inTree)) #树的深度
    plotTree.xOff = -0.5/plotTree.totalW; plotTree.yOff = 1.0;
    plotTree(inTree, (0.5,1.0), '')
    plt.show()
createPlot(t_ID3)

createPlot(t_C45)
createPlot(t_CART)

3.4 验证
train_set = xigua2_0.loc[[1, 2, 3, 6, 7, 10, 14, 15, 16, 17]]
train_set
| 编号 | 色泽 | 根蒂 | 敲声 | 纹理 | 脐部 | 触感 | 好瓜 |
|---|---|---|---|---|---|---|---|
| 1 | 青绿 | 蜷缩 | 浊响 | 清晰 | 凹陷 | 硬滑 | 是 |
| 2 | 乌黑 | 蜷缩 | 沉闷 | 清晰 | 凹陷 | 硬滑 | 是 |
| 3 | 乌黑 | 蜷缩 | 浊响 | 清晰 | 凹陷 | 硬滑 | 是 |
| 6 | 青绿 | 稍蜷 | 浊响 | 清晰 | 稍凹 | 软粘 | 是 |
| 7 | 乌黑 | 稍蜷 | 浊响 | 稍糊 | 稍凹 | 软粘 | 是 |
| 10 | 青绿 | 硬挺 | 清脆 | 清晰 | 平坦 | 软粘 | 否 |
| 14 | 浅白 | 稍蜷 | 沉闷 | 稍糊 | 凹陷 | 硬滑 | 否 |
| 15 | 乌黑 | 稍蜷 | 浊响 | 清晰 | 稍凹 | 软粘 | 否 |
| 16 | 浅白 | 蜷缩 | 浊响 | 模糊 | 平坦 | 硬滑 | 否 |
| 17 | 青绿 | 蜷缩 | 沉闷 | 稍糊 | 稍凹 | 硬滑 | 否 |
val_set = xigua2_0.loc[[4, 5, 8, 9, 11, 12, 13]]
val_set
| 编号 | 色泽 | 根蒂 | 敲声 | 纹理 | 脐部 | 触感 | 好瓜 |
|---|---|---|---|---|---|---|---|
| 4 | 青绿 | 蜷缩 | 沉闷 | 清晰 | 凹陷 | 硬滑 | 是 |
| 5 | 浅白 | 蜷缩 | 浊响 | 清晰 | 凹陷 | 硬滑 | 是 |
| 8 | 乌黑 | 稍蜷 | 浊响 | 清晰 | 稍凹 | 硬滑 | 是 |
| 9 | 乌黑 | 稍蜷 | 沉闷 | 稍糊 | 稍凹 | 硬滑 | 否 |
| 11 | 浅白 | 硬挺 | 清脆 | 模糊 | 平坦 | 硬滑 | 否 |
| 12 | 浅白 | 蜷缩 | 浊响 | 模糊 | 平坦 | 软粘 | 否 |
| 13 | 青绿 | 稍蜷 | 浊响 | 稍糊 | 凹陷 | 硬滑 | 否 |
model = TreeGenerate(D=train_set, A=set(train_set.columns)-set(["好瓜"]), tree_type="ID3")
createPlot(model)
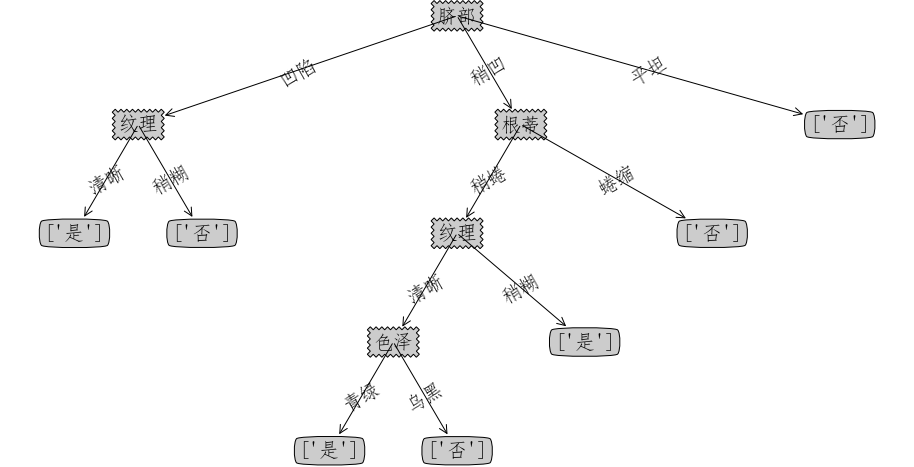
predict(D_test=val_set, my_tree=model)
# [output]:
# [array(['是'], dtype=object),
# array(['是'], dtype=object),
# array(['否'], dtype=object),
# array(['是'], dtype=object),
# array(['否'], dtype=object),
# array(['否'], dtype=object),
# array(['否'], dtype=object)]